Some of you may follow the oil & gas industry and some of you may not. Either way, it is pretty difficult to know absolutely nothing about what is going on in industry. Someway or another, it seems everyone has either a family member or friend working in the industry. Let’s face it…it is HUGE! I have posted a couple blogs about the natural gas and oil prices. Of course, the prices are still low. So I wanted to simply look back on our past when it comes to natural gas prices. How much have the prices changed? How high has the price gotten? Why has the price been so high in the past?
I have discussed what causes the price of natural gas to go up and down but I think it is interesting to take a look back in the past and see when these downturns and spikes in prices occurred.

In 2001, you can see one of the first big spikes in natural gas prices. This was caused by an increase of demand after many years of declined production. After this, there was an economic downturn which caused the prices to drop.
In 2005, you can see another spike which was reflected upon the hurricanes, Rita and Katrina. Because of these hurricanes, supplies were reduced from the Gulf of Mexico.

In 2008, you see a large spike in the summer and then a quick drop in prices in the winter. With weather being a factor in prices, natural gas follow the pattern of oil prices of spiking in the summer and falling in the winter. However, the normal natural gas price trend is prices rising in the winter and falling in the summer. Instead of seasonal weather playing an important role in prices, hurricanes Gustav and Ike cause production shut-ins in the Gulf of Mexico and Louisiana. In the summer of 2008, prices were $10.80 per Mcf. In the winter, the prices dropped to $5.87 per Mcf.
Since the fall in 2008, the prices have been relatively similar with no major spikes. This is due to the economic recession and increased supply from the rapid growth of shale and unconventional gas resources.
In 2010, there were some continuing low points. The was caused by simply the increase in natural gas storage with relatively normal demand. The price dropped from the average price of $5.83 to $4.25 in December. In October, the price reached a low average of $3.43.
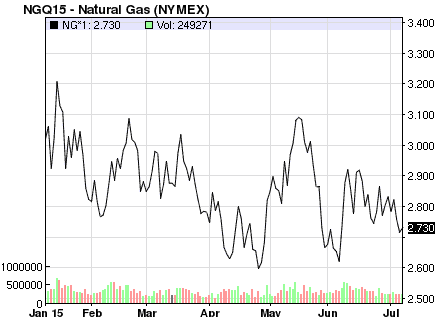
As you can tell from the chart, there has been slight fluctuation in the price but not any major spikes. This year it has been a long year of low prices. The chart below shows the current price at $2.73.
Natural gas prices have continued to reach record highs and record lows over the years. Personally, I am ready for prices to reach another record high!